Often one hears questions from people who are far from this subject, but who traders are and how they can determine the price movement and make such serious forecasts. How can they make money on this and build a fortune? What is Technical Analysis, patterns, levels and more?
Today I will try to answer your questions. After all, now more than ever, this topic is the most popular and is pouring out of every “iron!
What are technical analysis patterns
Every year there are more and more traders and financial analysts. Everyone is trying to develop his own trading strategy and become the author of a new chart analysis tool.
In modern parlance, patterns are steady, allowing you to analyze the current price situation on the chart, using certain techniques and analytical tools. It allows you to anticipate and simulate the movement and fluctuation of the price. Whether the upward trend will continue or reverse.
Trend Shapes
The Pennant is a triangle-shaped figure that indicates an upward price movement. If you draw a line connecting the maximum and minimum points of oscillation, then you get converging lines.

If you notice such a moment on the chart, it may indicate an imminent trend reversal and breakout of the levels.
After overcoming the space spent, the price begins to rise rapidly.
However, it is possible to determine that we have a triangle in front of us after narrowing the space itself. This can be determined by three corrective waves.
As a rule, the first corrective movement is followed by the second, directed along the trend. But the previous peak correction will no longer be reached.
Cup with Handle – this figure appears exclusively on an uptrend and indicates its continuation.

A figure appears during a period of trend consolidation. Its left wall is a correction of the price movement down, and the right wall is the same correction upwards, to the initial level. The bottom connects the two walls. It can be either in the form of a tight consolidation, as on the chart, or in the form of a pointed bottom. The handle moves away from the right wall of the cup and is in fact another figure – the Flag.
During the formation of the left wall of the cup, the trading volumes decrease, and during the formation of the right wall, they increase. During the formation of the bottom, they remain stable. The cup is considered fully formed when, after the formation of the handle, the price breaks through the resistance level and moves up. Such a breakdown should be accompanied by a sharp increase in volumes.
The Double Top or Double Bottom patternis also a well-known chart pattern with a reversal pattern. The peculiarity of this pattern is that the double top or double bottom is symmetrical. The chart moves in a straight line and does not have any slopes, unlike other patterns.

This figure also gives a signal to buy if the price overcomes the bottom line of the figure, while this breakdown must necessarily be accompanied by an increase in trading volume, which indirectly confirms the truth of the trend.
This figure is based on the fact that after the first price correction, the second price peak follows. Support and resistance lines can be drawn between corrections and peaks. But as a rule, a support line is enough, it is also called the neck line. It is after overcoming this line that further price manipulations follow.
The scheme of the “double bottom” pattern is very similar to the “double top”, however, the shapes here are not so symmetrical anymore.

The lower parts of the figure have different shapes, but not always. The image shows that a smoother transition has a name – Eve. Sharper – Adam.
Remember that the Double Bottom pattern will only be valid in a falling market, and the Double Top pattern will only be valid in a rising market. Moreover, the stronger the trend, the more powerful the reversal can be.
This is just a small part of what patterns traders use. There are a huge number of them, we have shown the main ones.
And now let’s move on to candlestick analysis patterns.
Candle Analysis Patterns
Candlestick analysis patterns are a set of Japanese candlesticks that can be used to understand whether the trend will reverse.
This method of analysis is good to use when no figures are visible on the chart. Among the main patterns of candlestick analysis, one can single out: “bullish or bearish engulfing”, “veil of dark clouds” and “clearance in the clouds”, as well as “morning and evening star”.
- Bullish engulfing candlestick pattern
This situation can only be found on a downtrend. In the event of a bullish engulfing situation, a sharp reversal of the current trend is expected.
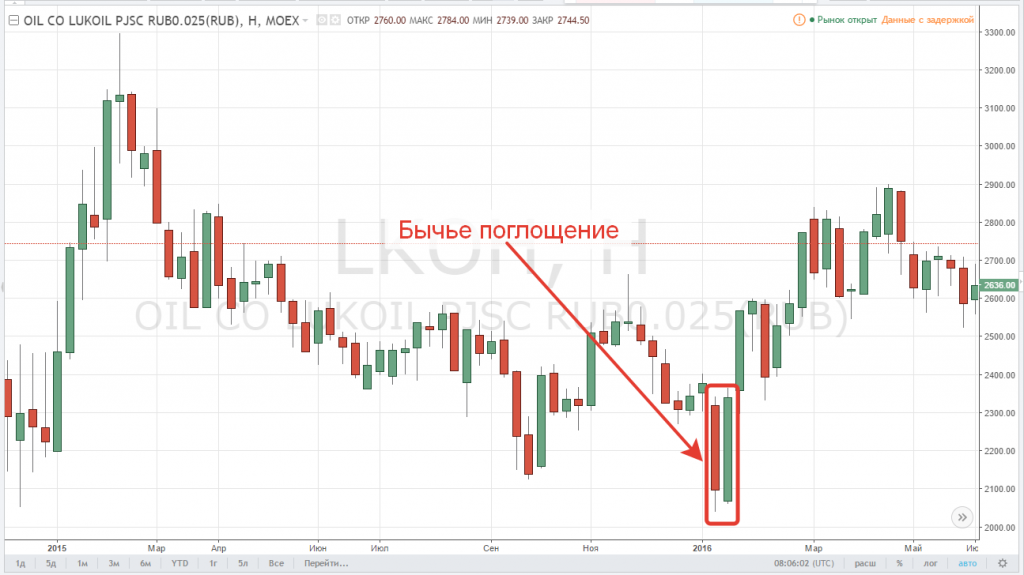
It is imperative that the second candle fully absorb the first, but the main thing is that the absorption is at the level of both candles.
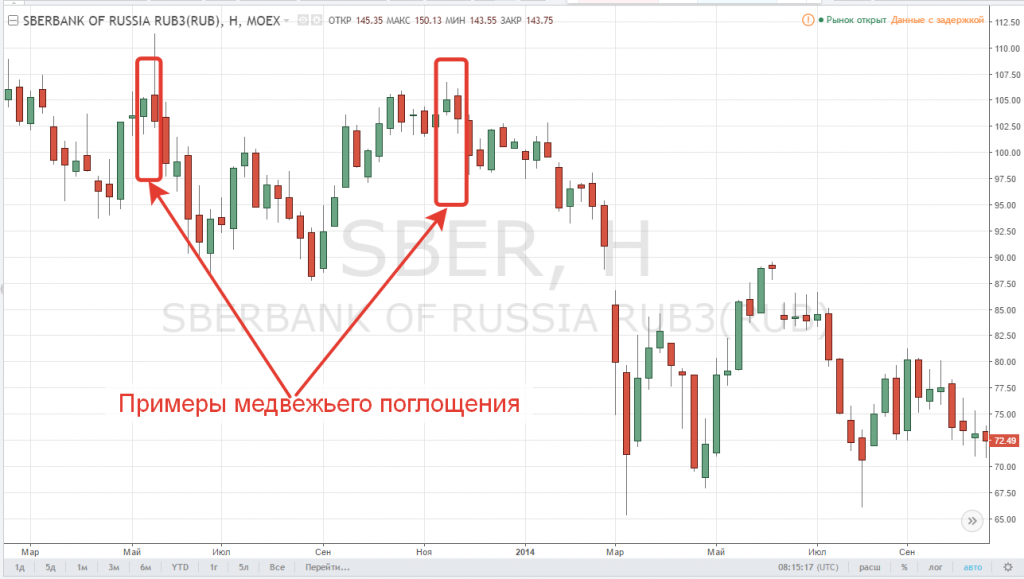
- Candlestick pattern “Bearish engulfing”
The exact opposite of the bullish engulfing pattern. This situation occurs when there is an uptrend. With a high degree of probability, this will be followed by a change to a downtrend.
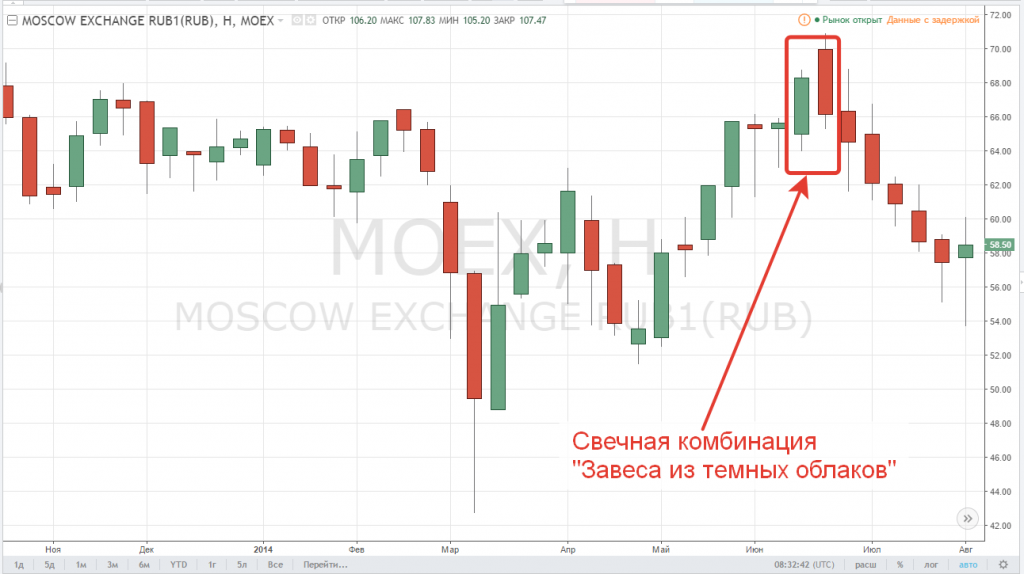
- “veil of dark clouds”
The emergence of candlestick pattern “veil of dark clouds” seeing such a combination of candlesticks, you can be sure that the uptrend will soon change to a downtrend. In the Dark Cloud Cover candle combination, the first candle is a rising candle (in the figure below, growing candles are marked in green). The next day, the opening price exceeds the high of the previous trading day.
However, by the end of the day the closing price is close to the daily low and overlaps a large part of the body of the previous growing candle.
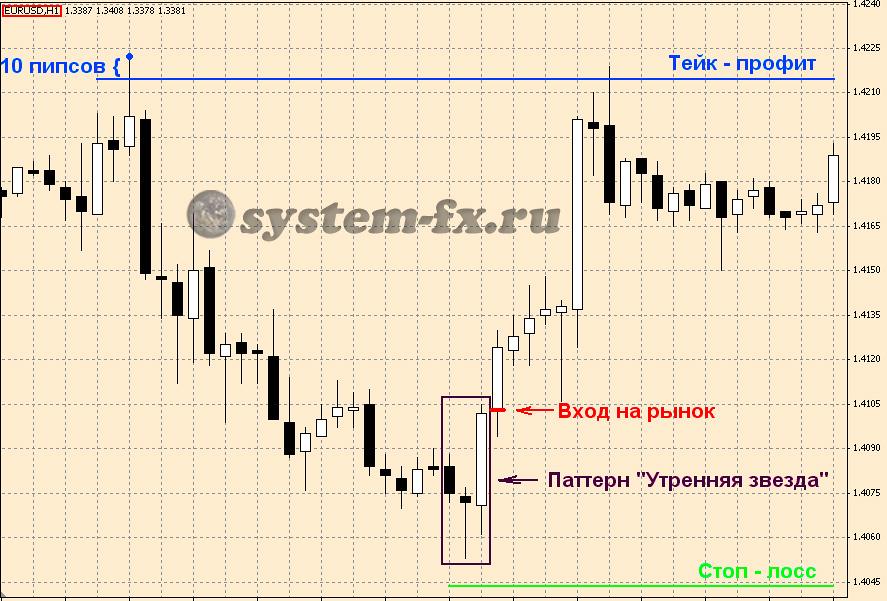
- Morning Star Candle Combination
When you see this combination, you can expect a rapid change in the trend to the opposite one. The pattern consists of a first candle with a long body. Then rides a candle with a smaller body, which is directed downward.
Japanese candlesticks are very good for analyzing future trends. Ideal for novice traders and analysts. They stand out well on the chart. The candlestick patterns make it easy to see if the chart is in a bearish or bullish trend.
Exit.
If you are determined to master the profession of a trader, you will need to master and learn a lot of information. Today we’ve broken down just a small part of what a trader can be guided by.
But if you should know that trading is very profitable. The profit that you can get, overrides all the difficulties in learning and working.
Good luck in your endeavors!
Read more articles about cryptocurrencies and mining at CRYPTO-WALLETS.ORG.
The Telegram channel about cryptocurrency and mining Bitcoin, Ethereum, Monero and other altcoins: